MHS Transactions, Series 3, Number 31, 1974-75 Season
|
This paper represents a preliminary investigation of changing spatial patterns of ethnic occupance in Manitoba during the period from 1921 to 1961. Over the past few decades a dominant trend in Manitoba, as elsewhere in Canada, has been that of a declining farm population. Frequently this decline is accompanied by the stagnation or decline of the smaller agricultural service centres. Even earlier the rural sector was declining relatively as out migration exceeded in-migration.
Since the literature on ethnic groups, a very substantial literature in the Prairie Provinces, contains numerous references to variations in group attitudes it seems reasonable to conclude that the processes of population change at work would affect the various ethnic groups rather differently. One might expect the spatial pattern of ethnic occupance, even after the initial settlement process was essentially completed, to be in a stage of change or flux, one group expanding another retreating. A large number of possible variations in group attitudes and traits might account for such a situation. Some of the factors one might expect to have been or still to be operative are: variations in degree of attachment to farming and rural life, variations in desire to retain group identity or solidarity, variations in birth rate, variations in opportunities, real or perceived, in the urban environment, and variations in attitudes to education and in level of educational attainment. This list of factors is suggestive only and is by no means exhaustive. The purpose of this paper is to establish the changes that have occurred in the patterns of spatial occupance for selected ethnic groups. In dealing with the groups explanations will be offered only at a general level except where the secondary literature makes possible more specific observations.
Among the Prairie Provinces, Manitoba was selected for analysis for a number of reasons. Manitoba was the first to be settled and consequently the process of initial settlement was largely completed by 1921. This provides a longer period for analysis relatively uncomplicated by a continuing initial settlement process. Secondly, the secondary literature on Manitoba's ethnic groups is more comprehensive than that of either Saskatchewan or Alberta, a factor of some importance to this paper. Thirdly, initial settlement resulted in a higher index of ethnic group segregation within the limits of identification set by census subdivisions (municipalities). Fourthly, in Alberta and Saskatchewan a number of groups or parts thereof arrived via the United States with attitudes probably less intact than those with direct arrival from Europe. Finally, apart from some municipalities along the agricultural fringe, census subdivision boundaries have remained unchanged in Manitoba throughout the time period under study, a necessary prerequisite for time series analysis.
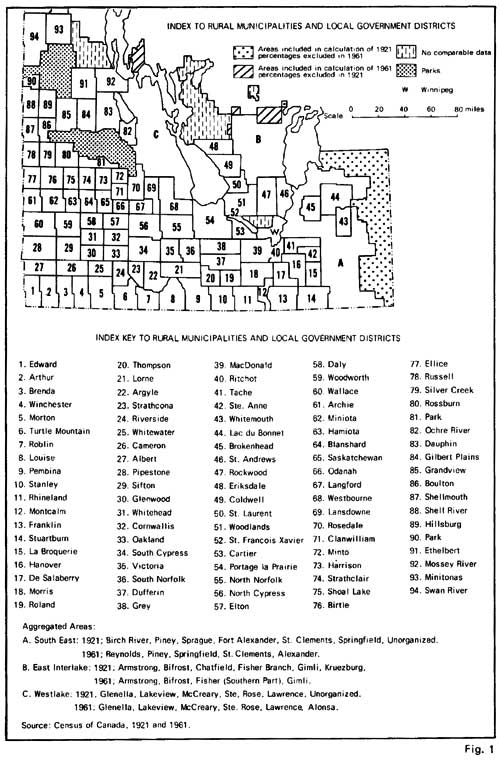
Figure 1. Index to Rural Municipalities and Local Government Districts
Before an investigation of the changing spatial patterns of ethnic occupance could be undertaken a number of problems required resolution. The first of these was the selection of the "ethnic groups" for analysis. [1] A discussion of the problems involved in the use of census data on origins can be found in an article by N. B. Ryder. [2] In this paper Ryder states that "from the evidence presented above, it seems fair to conclude that the usefulness in research of Canadian statistics on origins is probably limited for the most part to dividing the population into four broad groups: the British, the French, the other whites, and the non-whites, and that attempts to carry out serious, more detailed research on origins require extreme caution, particularly with regard to variations through time." [3] Two of the groups selected for analysis were the British and the French at least meeting in part Ryder's reservations. [4] It was deemed desirable to include a few other groups as well. The third group selected was that of the Mennonites, whose number are available from census data on "religion" rather than "origin." Not only does this group most clearly meet the qualifications of "ethnicity," but numerically it represents one of the more important ethnic groups in the province. [5] The final group selected is referred to as Ukrainian-Polish since it was desirable, because of their numerical importance, that a Slavic group be included. This compromise was arrived at after a careful consideration of Ryder's reservations. [6] Reinforcement for the decision is provided by an observation by W. L. Morton. Statistical data on this group is least satisfactory and the results should be treated with some caution.
A second problem requiring resolution was that of defining rural population. Unfortunately origin and religion data are not available for farm population at the census subdivision level. For the purposes of this analysis rural population is the population of census subdivisions (largely municipalities) exclusive of incorporated towns. In addition the entire population of the census subdivisions making up metropolitan Winnipeg in 1961 has been excluded. While incorporated communities are excluded it has been necessary to include the populations of many smaller functionally urban, but unincorporated communities. In addition since the analysis required comparative data for both 1921 and 1961 it was necessary to include in the 1961 data at the census subdivision level the population of communities incorporated between 1921 and 1961. [8]
The third major problem is that of placing the change in each group's proportion within a given census subdivision into the framework of changes in the subdivisions total rural population in the years from 1921 to 1961. In considering the changing "ethnic mosaic" it is well to bear in mind the ways in which change could occur in the relative proportion of each group. Firstly with rural de-population and farm consolidation a group with a greater tendency to stay on the land could increase its proportion vis a vis other groups. No movement into the area need be involved at all. Secondly, members of one group on leaving could sell their farms to individuals of another group coming into the area, thus increasing the proportion of the latter group in the area. Thirdly, in areas with an expansion into new farmland after 1921 the selective or heavier in-migration by members of one group could raise their proportion without any retreat or abandonment by other groups. All three of these processes could have been operating in a single subdivision during the time period under analysis. Further complications in the details of the process of changing ethnic proportions are added by the fact that the rural population also includes non-farm population, largely made up of residents of unincorporated functionally urban centres.
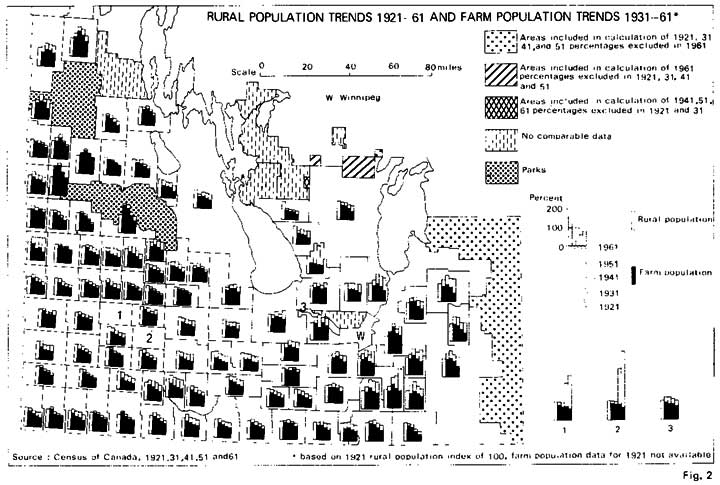
Figure 2 has been prepared to make it possible for the reader to study the trend of rural population during the period from 1921 to 1961. In addition trends in farm population since 1931 and the relative importance of the farm and non-farm components of the rural population can be seen for each census subdivision. [9] In most subdivisionals rural population was larger in 1921 than in 1961. In many cases, however, rural population increased after 1921 before declining again, although often this increase is minimal. In terms of the five dates shown 28 areas recorded maximum rural population in 1921, 33 areas recorded a maximum in 1931, 29 areas a maximum in 1941 and one and five areas recorded maximums in 1951 and 1961 respectively. While the details of the processes which have brought about changing ethnic proportions cannot be documented it is possible to state that most of the changes occurred within the framework of stagnant to declining rural population. The map makes it possible to isolate the more obvious exceptions and to observe the trends, if not the dynamics of in-migration and out-migration, for every subdivision.
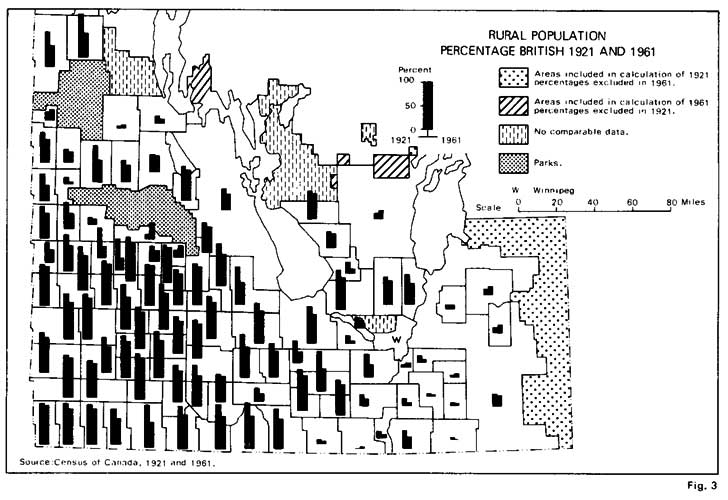
Figure 3 shows the British as a percentage of total rural population in both 1921 and 1961. One notices at both dates the relative concentration of the British in the south-west of the province but a comparison of the proportions of British origin in 1921 and 1961 demonstrates their widespread decline. This decline in proportion of British origin occurs virtually throughout the whole of the area under analysis.
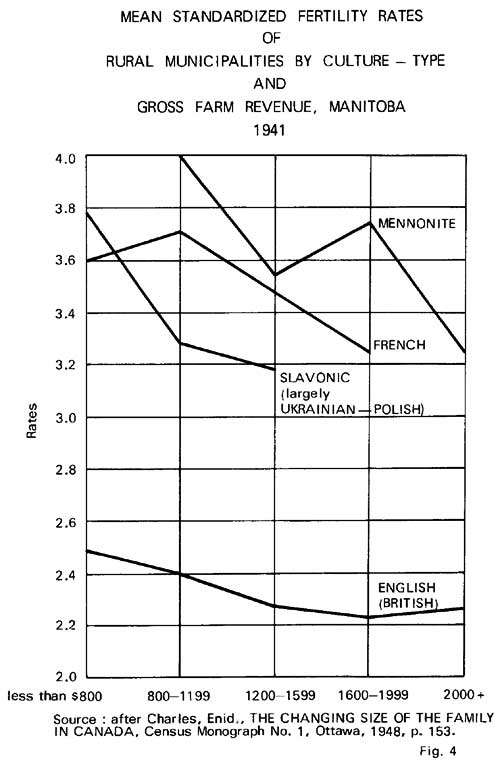
From Figure 4 it can be seen that in 1941 the rural municipalities of the English [British] culture-type had a much lower fertility rate than did rural municipalities of the other culture-types [ethnic groups] selected for analysis. This one variable would seem to provide some insights into the relative decline in the British proportions. Figure 5 provides reinforcement for this interpretation.
Figure 4. Mean Standardized Fertility Rates of Rural Municipalities by Culture Type and Gross Farm Revenue, Manitoba, 1941
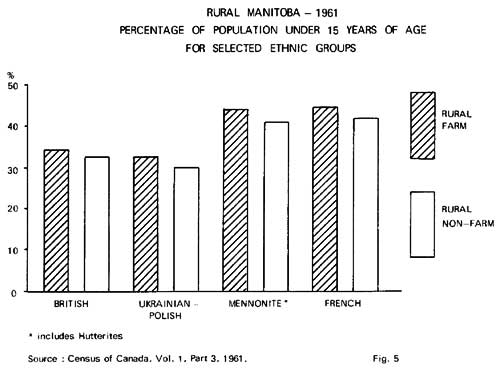
Figure 5. Rural Manitoba-1961: Percentage of Population Under 15 years of age for selected ethnic groups
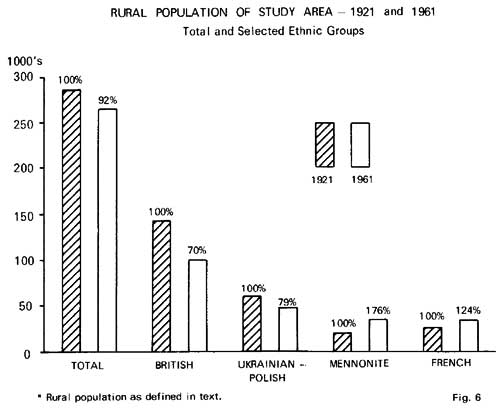
Lower fertility levels cannot, however, account for the marked decline in the rural population of British origin. With stable to declining rural and farm populations during the period under review fertility levels among the British origin group have been more than high enough to provide replacement population. As Figure 6 shows, while rural population in the study area declined by eight percent in the years from 1921 to 1961 rural population of British origin declined by thirty percent. One must therefore assume differential out-migration to account for the heavier British declines and look to other variables, such as those already suggested in the introduction, in accounting for this. R. England, in his study of settlement in western Canada, found that a much larger proportion of young people, under 21 years of age, of non Anglo-Saxon stock remain on the land than those of Anglo-Saxon stock. [10] Little is written about the attitudes of the British, probably because they form the 'dominant ethnic group.' Rather the secondary literature measures the attitudes of other groups, usually qualitatively, against this supposed but not clearly identified norm. British attitudes and traits are at best recognizable implicitly rather than explicitly. The role played by the lower British origin fertility levels must be placed in this broader but non quantitative context.
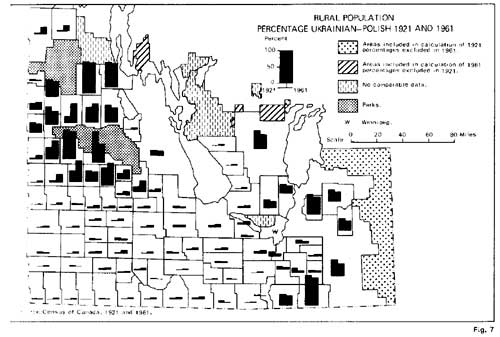
The proportions of the rural population of Ukrainian-Polish origin in 1921 and 1961 is shown by Figure 7. In relative, and in absolute terms, this group is concentrated along the eastern and northern fringes of the agricultural part of the province at both dates. Over the forty year period, however, many municipalities experienced marked increases in the proportion of the rural population of Ukrainian-Polish origin. The trends are, however, by no means to increase only, as relative decreases are by no means uncommon. Figure 4 shows that fertility rates for the Slavonic culture type [largely Ukrainian-Polish], while higher than the English [British] were somewhat lower than either the French or Mennonite in 1941. By 1961 we see (Figure 5) that there is little difference between the British and the Ukrainian-Polish groups in terms of proportions of rural farm and rural non-farm populations under 15 years of age. The fertility variable would appear to be of declining utility in explaining Ukrainian-Polish advance vis à vis the British and would tend to suggest, other things being equal, Ukrainian-Polish retreat in areas of Mennonite or French origin competition.
Despite some proportional declines in Ukrainian-Polish origin proportional increases dominate and in the period under analysis we see evidence of considerable expansion. Charles H. Young in writing about the Ukrainians was aware of this fact." According to Young this expansion began toward the close of World War I following the sudden accession of wealth of large numbers in the group, as a result of a high price for wheat. He suggests that several factors favored this expansion. First, the large families meant a surplus of young men on the land and it was the ambition of most fathers to put each son on the land. [12] Secondly, while the high fertility made for an overflow of population it provided a larger working unit with more manpower per family. Thus little hired labor was necessary while British farmers on the other hand often paid their only surplus cash to the hired man. Finally, the Ukrainians had a low standard [cost] of living compared with most competing groups. This meant they could survive where others failed as they would put up with harder conditions. [13] In good districts this lower standard [cost] of living achieved the same result as it meant greater potential wealth with which to buy lands, for, with their own needs satisfied with products of their gardens, almost all the cash derived from the sale of their grain crop counted as profit.
Figure 4 suggests that over a part of the period under review Ukrainian Polish fertility rates were considerably in excess of British rates. A comparison of Figures 3 and 7 will indicate that the most significant increases in the proportion of Ukrainian-Polish origin have occurred in areas dominantly of British origin in 1921. The areas of major increases in Ukrainian-Polish proportions are in the north-western part of the province's agricultural area and may be conveniently divided into three parts, the south slope of Riding Mountain, the Dauphin valley and the Swan River valley.
The expansion south of Riding Mountain has been remarked upon by a number of authors. P. F. Yuzyk notes that in this area, after about 1917, the Ukrainians gradually began to expand toward the south, and observed further, at the time of writing, that the process was still in evidence. [14] England, writing in 1936, stated that the area between Oakburn and Shoal Lake, which had been entirely Anglo-Saxon ten or fifteen years earlier, was gradually becoming Ukrainian as increasing numbers of them bought up the farms. [15] Murchie and Grant note that in Harrison municipality Ruthenians [Ukrainians], in their rising prosperity, were offering more for the farms of nearby English settlers than they had to pay for equally or more desirable homes elsewhere. [16] Yuzyk supports the interpretation that the Ukrainians in the process of expansion placed a premium on locations near to core areas of Ukrainian settlement. [17] The expansion of the groups in the south slope area is accompanied by decreases in both total rural population and farm population, as well as relative and absolute decreases in the population of British origin. The relative increase in proportion of Ukrainian-Polish origin has in most cases been accompanied by absolute increases as well. Thus the area has experienced active expansion of the Ukrainian-Polish group with retreat of the British group to accommodate the expansion.
In the Dauphin valley Ukrainian-Polish advance is limited to the municipalities of Gilbert Plains and Grandview. In Gilbert Plains the increase in the proportion of Ukrainian-Polish origin has been accompanied by an absolute decline in their numbers. Thus differential out-migration would seem to be the important process. Grandview experienced a rather different and more complex process. The marked proportional increase in the Ukrainian-Polish group has been accompanied by a doubling of their numbers between 1921 and 1961 and a fifty percent reduction in the population of British origin. But in addition farm population increased until 1941. This suggests that both a continuing settlement process and differential out-migration are responsible for the marked proportional increase of Ukrainian-Polish origin.
The Swan River valley is the third area with marked increases in the proportion of Ukrainian-Polish origin. Like Grandview this area also experienced marked increases in both total rural and farm population until 1941. While relative British decline is marked, absolute decline is not so great. A significant share of the increases in the proportion of Ukrainian-Polish origin can be attributed to the continuing settlement process rather than to their purchase of British farms.
Only a few areas of marked decrease in the proportion of Ukrainian-Polish origin stand out on Figure 7. The decline in proportion of Ukrainian-Polish in Park L.G.D. to the south of Riding Mountain was due to an influx of British settlers into the area in the 1920s. In Boulton Municipality, west of Riding Mountain, the explanation is similar although the post 1921 settlers were of German and Romanian origin rather than British. In much of south eastern Manitoba the explanation, judging from the increases in total rural population in evidence on Figure 2, would in part appear to be the same, an influx of settlers of other origins after 1921. This was also, in part, an area of vigorous Mennonite and French expansion with possibly some displacement of the Ukrainian-Polish group. In the eastern Interlake area the Ukrainian-Polish group settled on the poorest land and part of the explanation of their decline may be a higher rate of out-migration.
Despite the considerable expansion of the Ukrainian-Polish group when measured in relative terms the absolute decline in the rural population of Ukrainian-Polish origin has been considerable (see Figure 6). It was noted earlier that the major concentrations of this origin group are to be found on the eastern and northern margins of the agricultural area of the province, often in the more marginal areas for agriculture. In addition early agricultural densities tended to be higher and farm sizes smaller for the Ukrainian-Polish group than for other groups in similar areas, probably due in part to more limited capital resources. Many of these areas have experienced rates of decline in farm population since 1931 or 1941 considerably in excess of provincial rates. Excellent examples of this are the municipalities of Stuartburn, Rossburn and Ethelbert and the eastern Interlake area (see Figure 2). The heavy population losses from such areas as these has meant a considerable absolute decline in rural population of Ukrainian-Polish origin despite the fact that the group has increased in relative and even absolute terms in many areas often nearby to these core regions.
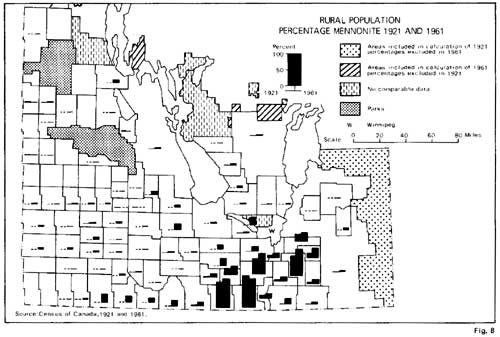
In 1921 the area of Mennonite settlement was spatially very restricted despite the fact that initial Mennonite immigration was virtually completed by 1880 and there had been significant increases in their numbers. Between 1921 and 1961 the expansion of the Mennonites beyond the areas of initial settlement in the East and West Reserves was considerable as can be seen from Figure 8. [18]
The marked concentration of the Mennonites prior to 1921 in their areas of initial settlement is commented upon by E. K. Francis. [19] As he explains, in the underpopulated East Reserve (Hanover Municipality) population growth could occur without spilling out into surrounding municipalities and thus marked expansion into new areas was unnecessary. The whole West Reserve (Rhineland and the eastern half of Stanley Municipalities) on the other hand soon began to suffer from over-population. Good land was available elsewhere and the Mennonites could afford to pay for it but they insisted on group settlement and kept the young people at home until an opportunity arose to found daughter colonies in Saskatchewan which somewhat eased the pressure. Soon all available land within or adjacent to the West Reserve was exhausted. The answer then became the division of farm holding within the family forced upon them by their system of inheritance. In 1921 the three municipalities of Hanover, Rhineland and Stanley accounted for eighty percent of the Mennonite rural population and most of the remaining twenty percent were to be found in immediately adjacent areas.
The years from 1921 to 1961 witnessed marked changes in the characteristics of Mennonite population distribution. Francis states that "In studying the development of Mennonite colonies in Manitoba one is struck by the dogged effort of the group to occupy contiguous tracts of land, to prevent outsiders from settling in their midst, and to expand compact settlements along their fringes rather than permit its members the acquisition of new land elsewhere. [20] Detailed maps in Francis's study show this contiguous expansion and the Mennonite populations of 1921 around the core areas of the original Reserves would seem to reflect this process. [21] Events since 1921 suggest that this process is only a part of the method of expansion. While areas adjacent to the original reserves have continued to record increases in Mennonite proportions many non-contiguous areas without Mennonites in 1921 recorded significant Mennonite proportions by 1961.
In the 1920s a large group of Mennonites left Manitoba for Mexico and Paraguay. This conservative group left because they felt that modern Canadian cultural values and habits were making inroads among their young people, thus threatening the existence of the group. The exodus of this group freed the Mennonite community from some of the influences that kept it so compactly settled despite economic pressure to expand. It also meant, however, that considerable land within the settlement blocks became available, through middlemen, to those who remained, although the emigrant group had refused to sell to them directly because they considered them renegades. [22]
In the same years, however, a liberal group of Mennonites from Russia emigrated to Manitoba. By 1930 about thirty percent of these two thousand families had settled on land abandoned by the conservative group in the West Reserve, another ten percent had settled in the East Reserve, perhaps twenty-five percent were scattered in a dozen larger blocks and about twenty percent lived in Winnipeg. [23] This arrival from Russia thus filled in part the farmland vacated by the conservative group thereby helping to maintain population pressure in the Western Reserve. It also started the dispersal of the Mennonites through the formation of numerous new settlements, and replaced a conservative group with a more liberal one. The great expansion of the group, as demonstrated on Figure 8 would seem to stem in large part from these events coupled with a high birth rate and a low rate of urbanization. [24]
Mennonite advances, as indicated on Figure 8, are strongest in municipalities in the Red River valley north of the West Reserve as far as Portage la Prairie and then west through North Norfolk, Westbourne and into Rosedale. As indicated by Figure 3 these advances seem largely at British expense in terms of changing proportions of rural population.
Increases in Mennonite proportions are also marked in Hanover and adjacent municipalities. This is an area showing increases in total rural population and farm population in the years from 1921 to 1941 suggesting that in part this advance was achieved through the pioneering of new lands rather than the purchase of existing units operated by persons of other origins. In Hanover municipality the fact that farms decreased in size from 1921 to 1951 suggests that in part the proportional increase of Mennonites was achieved by subdivision of holdings.
The final major feature of the pattern of Mennonite expansion (see Figure 8) are the increases in the Mennonite proportion along the United States border west from the Western Reserve as far as Morton municipality. [25] This expansion would seem to be largely at British expense (see Figure 3). In these municipalities rural population increased only slightly from 1921 to 1931 and since 1931 both rural and farm population have declined (see Figure 2). This suggests a process of replacement of the British origin group by Mennonites.
Many other municipalities without Mennonites in 1921 record some Mennonites by 1961. The three municipalities of Hanover, Rhineland and Stanley contained only fifty eight percent of the rural Mennonite population in 1961, a marked decline from the eighty percent of 1921.
Of the groups considered in this study the Mennonites have shown the most marked expansion. As Figure 6 demonstrates, while total rural population declined between 1921 and 1961 rural population of Mennonite origin increased considerably. The data on fertility (Figures 4 and 5) suggests that this variable is of some significance in accounting for this expansion. There is no doubt, however, that one must look to other variables, as the study by Francis so clearly demonstrates, to explain the behavior of the group.
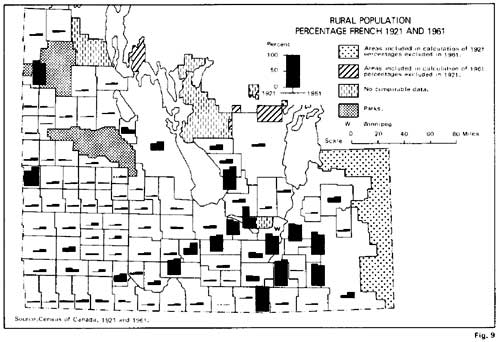
Figure 9 shows the proportion of rural population of French origin in 1921 and 1961. Unlike the three other groups no areas stand out at the census subdivision scale as being of exceptionally high French origin at either date. The greatest concentration of French origin in relative and absolute terms is the area to the south and south-east of Winnipeg. Other relative concentrations are found at scattered locations. In comparing the proportions of French origin at the two dates one observes that most municipalities recorded an increase in proportion of French origin but increases are widespread and few areas record increases of the same scale as the more notable increases of Ukrainian-Polish and Mennonite origin. On the other hand proportional decreases are not nearly so frequent as with the Ukrainian-Polish group.
Increases in proportion of French origin, while moderate, are widespread throughout the south-western quarter of the map area, a region of high British proportions in 1921. In this general area the increases are highest within and around the more notable relative concentrations of 1921, centred on the municipalities of Grey, Norfolk South and Ellice. This possibly indicates a spreading out from early core areas. Another area of notable increase is found in the south-east area. This is probably related in part to forest based activities and the French origin element here has a notable Métis component.
Notable decreases in proportions of French origin occur immediately to the west of Winnipeg and to the south east. To the west Cartier Municipality is an area that experienced a considerable expansion in Hutterite colonies after 1921 while St. Francis Xavier recorded a notable increase in Mennonites. To the south-east of Winnipeg Mennonite expansion would appear to account for relative declines in French origin in municipalities north and east of Hanover, the former East Reserve area of the Mennonites.
Like the Mennonites the French experienced an absolute increase in rural population in the years from 1921 to 1961 (see Figure 6). since fertility levels appear similar for both groups the rate of movement of population of French origin out of rural areas has been higher than the Mennonite rate. In the light of overall changes in rural population it is fair to conclude, however, that French attitudes and traits favor their remaining more rural than has the total population.
Through a description of the changing proportions of four groups between 1921 and 1961 it has been demonstrated that Manitoba's rural ethnic mosaic has changed appreciably. It has been shown that the dynamic nature of the ethnic mosaic can be attributed to differential migration rates from the rural sector although it has not been possible to quantify these rates. It has been suggested that these differential migration rates stem from variations in group attitudes and traits although these variations have not been isolated to any appreciable extent.
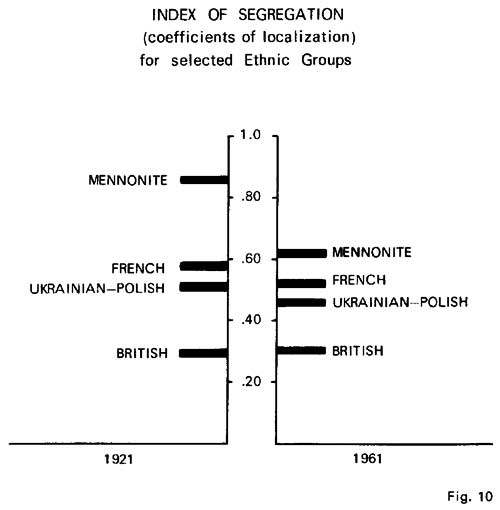
As time progresses the differences in group values that have resulted in the changes just documented would tend to diminish. [26] The maintenance of minority group values is no doubt made easier when in spatial terms the group is relatively segregated. [27] Changes in the scale of spatial organization of rural prairie society has undoubtedly worked in the direction of a homogenization of values. While at the scale of this study changes in degree of inter-group interaction cannot be measured, it is possible to measure in broad terms the spatial segregation of the four groups in both 1921 and 1961 and to observe the direction of change. Figure 10 is an index of segregation for each of the groups in both 1921 and 1961. On this index (coefficient of localization) a group can theoretically record a value anywhere from 0 (no segregation) to 1 (complete segregation). [28] As can be seen shifts have occurred between 1921 and 1961 in the relative degree of group segregation. The shift has been most significant for the Mennonite groups and their index of segregation was appreciably lower in 1961 than in 1921. Both the French and the Ukrainian-Polish groups also exhibit a lower index of segregation in 1961 than in 1921 although the magnitude of their shift is less spectacular. The British group has remained almost the same, in fact the segregation index has increased marginally. Their proportion of total rural population declined from nearly fifty percent in 1921 to only thirty-seven percent in 1961 suggesting that the slightly higher index is a result of somewhat higher rates of out-migration from areas where they represented small proportions of total rural population in 1921.
On the basis of the analysis undertaken it seems plausible to suggest that differences in group attitudes toward rural life account in large part for the changes that have occurred in the segregation indices. Rates of out-migration have varied among the groups during the study period. Members of groups more resistant to leaving the rural sector have in large part only been able to remain within the rural sector by occupying positions vacated at greater rates by members of groups less resistant to out-migration. This process, by lowering the index of residential segregation of the minority groups, is therefore by inference, diluting further the very values initiating the differential response.
1. The term 'ethnic group' is used in this study in much the same way as the term is used popularly in the Prairie Provinces. The groups have been identified on the basis of origin and religion data from the Census of Canada without recognition of the variations that must exist in terms of degree of acculturation or assimilation among members of the groups so identified. The appropriateness of the term when defined in terms of a group distinguished by common cultural characteristics undoubtedly varies from group to group and through time. As F. G. Vallee points out (see Vallee, F. G., "Regionalism and Ethnicity: The French-Canadian Case," pp. 19-25 in Card, B. Y. (ed.), Perspectives on Regions and Regionalism and Other Papers, Edmonton, Alberta, 1969) on pages 19 and 20. "Like social classes, these so-called ethnic groups are really population categories, some of which possess a framework of institutions serving the ethnic interests and needs, others of which do not."
2. Ryder, N.B., "The Interpretation of Origin Statistics," Canadian Journal of Economics and Political Science, Vol. 21, (1955), 466-479.
4. As the dominant group in Manitoba it seems probable that the British numbers grow through transference. While Ryder suggests that the French origin data is usable it should be noted that in Manitoba this means the inclusion of considerable numbers of Métis within the French group. This inclusion is probably most significant in municipalities in the eastern and northern margins of the study area.
5. For a study on the Mennonites in Manitoba see the volume by E. K. Francis, In Search of Utopia, (Altona, Manitoba, 1955). This study leaves no doubt that the Mennonites represent one of Manitoba's most distinctive "ethnic groups." In both 1921 and 1961 census data on Mennonites included Hutterites. It was possible to subtract the numbers of Hutterites from the Mennonite figures at the census subdivision (municipality) scale. A special tabulation from the General Population Section, Census Division, made this possible.
6. It was felt desirable that a Slavic group be included in the analysis but there was difficulty in deciding the best procedure to follow. Ryder's paper noted above deals with the problems of Ukrainian origin data. The final decision was to refer to the group as Ukrainian-Polish. In 1921 this includes the aggregated figures from three origin groups, Ukrainian, Austrian and Polish. A tabulation of Austrian and Ukrainian origin data was made for the years 1921, 1931, and 1941 to see if there was an abrupt shift of people reporting Austrian as their origin to reporting Ukrainian (see Ryder, pp. 474-475). Since the shift occurred and occurred most notably in the "Ukrainian areas" of the province the author feels justified in making this decision as the soundest course possible. Ryder notes a defection of Ukrainians to Polish origin in 1931 (Ryder, p. 475). It was therefore decided to include Poles as well. By 1961 Austrian origin was not given at the subdivision level in the census so only stated Ukrainian and Polish origins were included in the Ukrainian-Polish group. This exclusion of Austrians in 1961 may seem to be an inconsistency but is probably sounder than Austrian inclusion would have been by this date. Between 1921 and 1941 the Austrian origin group in the rural population under study declined from over 20,000 to just over 3,000. This gives some indication of the amount of inflation of the Ukrainian-Polish group in 1921 as a result of the inclusion of Germanic Austrians. It seems probable that the inflation is even less for Austrian origin data in 1941 may be inflated by people of German origin in the 1931 census calling themselves Austrian in 1941. Ryder notes (see p. 472) that the data suggests, "that four origins have profited at least temporarily from war-inspired accessions of German, viz., the Austrian, the Russian, the Netherland, and the British."
7. In Manitoba, A History, (Toronto, 1957), Morton states on page 309 that, "The two main Slavic groups to settle in Manitoba were the Ukrainians, then for the most part called Galicians from the district of the origin of the majority of them, and the Poles. Of these the Ukrainians were much the more numerous, and also the more assertive. They were, in fact, soon to assimilate the Poles to a considerable degree in themselves." Morton's comment above and Ryder's observations referred to in the previous footnote suggested that in defining a Slavic origin group the course of action described be taken.
8. This meant that 22 villages and towns included in 1921 but subsequently incorporated prior to 1961 were added to their respective census subdivision figures to arrive at comparable data for each date. These were, with subdivision in brackets, the following: Steinbach (Hanover), St. Pierre (De Salaberry), Altona (Rhineland), Crystal City (Louise), Cartwright (Roblin), Waskada (Brenda), Dunottar (St. Andrews), Glenboro (Cypress S.), MacGregor (Norfolk N.), Treherne (Norfolk S.), Teulon (Rockwood), Erickson (Clanwilliam), Riverton (Bifrost), St. Lazare (Ellice), Benito and Bowsman (Swan River), Minitonas (Minitonas), Ste. Rose du Lac (Ste. Rose), Ethelbert (Ethelbert), Great Falls and Powerview (Alexander), Lac du Bonnet (Lac du Bonnet).
9. In three areas, a portion of south-eastern Manitoba, a part of both the Interlake area and the Westlake area, it was necessary to aggregate subdivisions because of boundary changes. The key to the Index Map (Fig. 1) lists the census subdivisions aggregated for each of these areas in both 1921 and 1961. As the maps show it was necessary to include the population of areas in both 1921 and 1961 that were excluded at one of the dates. Total population figures available for these areas from township data in the census made it possible to check the total numbers involved. It can be stated that they do not significantly affect the changes mapped for these areas.
10. England, Robert, The Colonization of Western Canada (London, 1936) p. 166.
11. Young, Charles H., The Ukrainian Canadians, A Study of Assimilation, (Toronto, 1931), p. 62.
12. In the literature on the Ukrainian group one is struck by the importance the writers place on the Ukrainian love of the land and hunger for more and better land. While such attitudes may not be of significance today or even toward the latter part of the study period they should be noted.
13. See Murchie, R.W. and Grant, H.C., Unused Lands in Manitoba (Winnipeg, 1926) for support of this view. For example on page 42 they state that, "It was observed on the survey that the ability of the Ukrainian to succeed where other nationalities have failed was due to the former making such remarkably good use of garden products. It was reported that one year's grocery bill for a family of five Ukrainians was in 1925 the ridiculously low sum of $150.00. There is much to be learned from the methods employed in such cases."
14. Yuzyk, Paul F., The Ukrainians in Manitoba (Toronto, 1953) p. 49.
15. England, Robert, op. cit., p. 138.
16. Murchie, R.W. and Grant, H.C., op. cit., p. 43.
17. Yuzyk, Paul F., op. cit., p. 43.
18. An explanation of the term "Reserve" can be found in Francis, E.K., In Search of Utopia, The Mennonites of Manitoba (Altona, Manitoba, 1955) p. 61. "The term "Reserve" in this context refers to a contiguous tract of land set aside by the Dominion Government for a certain number of years for the exclusive occupation by a homogenous group of settlers to be divided according to their plans." The East Reserve was coextensive with the present Municipality of Hanover while the boundaries of the West Reserve changed several times but corresponded roughly with the present Municipality of Rhineland and the eastern half of the present Municipality of Stanley.
19. Francis, E.K., op. cit., pp. 123-124.
24. Ibid., p. 187. Francis states that between 1921 and 1930 about 6,000 Mennonites left Manitoba for Latin American countries and about 8,000 Mennonite refugees from Communist Russia arrived in the province. Since, according to Francis, about twenty percent of the latter group settled in Winnipeg the direct effect on rural population numbers was minimal. It did, however, mean the start of a significant Mennonite urban community in Winnipeg that may have made urbanization for rural Mennonites a more attractive possibility. While the Mennonite population of metropolitan Winnipeg in 1921 was only 126 (Census of Canada, 1921) by 1931 it was 1178 (Census of Canada, 1931). It would seem the claim above by Francis that twenty percent of the group from Russia settled in Winnipeg is a bit generous. In 1961 a smaller proportion of Mennonites than of any other non-indigenous ethnic group in Manitoba, apart from Hutterites, lived in metropolitan Winnipeg (Census of Canada, 1961). For a study of the urbanization of Mennonites in Manitoba see John Friesen, "Manitoba Mennonites in the Rural-Urban Shift," pp. 152-158 in Leo Dreidger (ed.), Mennonites in Urban Canada, Proceedings of the 1968 Conference on Urbanization of Mennonites in Canada, University of Manitoba, Winnipeg.
25. Ibid., p. 205. Francis provides information on the location of settlements of the twenty-five percent of the Mennonite immigrants from Russia that settled in a dozen larger blocks. The reason why Morton Municipality, at the western end of this expansion corridor, recorded the greatest increase in the proportion of Mennonite origin is due to the fact that a number of settlements were started in the area in the 1920s by the immigrants from Russia.
26. In the foreword to the study by Victor Peters, All Things Common, the Hutterian Way of Life, (Minneapolis, 1965), H. C. Pentland states that "assimilation in the direction of a homogeneous culture has been proceeding, in truth, at a pretty rapid rate; and exaltation of Manitoba's "mosaic" is probably already more of an exercise in nostalgia than a description of current reality." The analysis undertaken in this paper suggests that differences in attitude have been important in past group behavior. The author agrees that these differences are becoming of less importance. It may well be that over the study period most of the changes in origin proportions occurred in the first decade or first two decades, while since 1931 or 1941 the 'ethnic mosaic' has remained rather static. Such a result would suggest that variations in attitudes toward rural life were in fact becoming relatively less important, as a static mosaic could only result from more uniform out-migration rates among the groups considered.
27. This is only one of numerous independent variables that could have bearing on the persistence or lack of persistence of ethnic minority group values. For a reasonably comprehensive list of variables see F. G. Vallee, op. cit., pp. 23 and 24.
28. Since each group is measured against the distribution of total rural population and index of I is not in fact possible. For example if an area contained .1 percent of the total population but 100 percent of the population of a particular group the index would be .999. (The decimal point is conventionally moved two places to the left in expressing the coefficient of localization). If an area has the population of a group it must record some percent of the total population.
Page revised: 22 May 2010