by Irene Hanuta
Winnipeg, Manitoba
|
Modern air travellers are well acquainted with the patchwork quilt that characterizes the landscape of southern Manitoba and indeed the prairie west. But what did this region look like a century and a half ago? An objective of my doctoral dissertation was to reconstruct land cover in southern Manitoba before the widespread onset of European agriculture. I did this by transferring the information in nineteenth century Dominion Land Survey (DLS) township maps to a computer-based Geographic Information System (GIS). The result was a map showing the locations of prairie, forests, wetlands, and other landscape features as they existed in the 1870s.
Before 1870, agriculture was a minor component of the southern Manitoba landscape with small subsistence farms mostly located adjacent to the Red and Assiniboine Rivers. With the arrival of large numbers of European settlers beginning in the 1870s, the landscape of southern Manitoba underwent a transformation. Manitoba’s population increased from approximately 10,000 in the 1850s to more than 150,000 by the turn of the twentieth century. The Dominion Lands Act of 1872 positioned Manitoba (and later Saskatchewan and Alberta) for an agro-economy. Extensive tracts of grassland and parkland areas were surveyed, settled, and cleared for farming.
The office of the Surveyor General, of the federal Department of the Interior, was created in 1871 to conduct legal surveys and prepare maps. The land of southern Manitoba was subdivided into townships, each township comprising 36 square miles divided into 36 sections one square mile each. A grid system employed township lines running east and west and range lines running north and south. The Canada-US boundary served as a baseline for the north/south component but a meridian baseline was necessary to describe land in an east/west plane. The First or Prime Meridian was established west of Winnipeg, at 97° 27’ 28.41” west longitude. Six additional meridians were established in western Canada as the survey progressed. The range component of the legal description is, therefore, accompanied by reference to east or west of a baseline meridian. The township system is still used today, thus making comparisons to modern conditions possible.
A different survey system existed along the Red and Assiniboine Rivers. The River Long Lot Survey, established in 1813, did not conform to the strict sectional grid. Most long lots consisted of a 660- to 792-foot river frontage and a strip reaching two miles back. In areas with river lots, the township system grid was applied where river lots ended. Official re-surveys of long lots were undertaken around the same time as township surveys of the 1870s resulting in administrative units termed Parishes.
Instructions for the Dominion Land Survey were compiled in manuals issued by the Department of the Interior. Numerous editions were printed, the first in 1871. The manuals focussed on technical aspects of the survey but they also included instructions for the recording of natural conditions. Each survey team was assigned a numbered Field Note Book in a standardized format that, according to instructions in the 1883 manual, was “to be a fair and exact copy of the original notes taken in the field.” Field notebooks, belonging to individual surveyors, were used to document a survey. These notebooks were then used in the compilation and production of the final legal survey for a particular township. Notebook entries were typically made for individual sections along the road allowance separating two sections. Therefore, detailed descriptions can be found for individual sections. Because field notebooks often recorded information in more detail, they contain written descriptions of land cover features not always transferred to the final township plans. Examples of documentation found in notebooks but rarely or never on township maps include observations of depth and quality of surface water; descriptions of stream banks and current speeds; availability and quality of subsurface water; typical tree trunk diameters in wooded areas; quantity and suitability of timber for construction or fuel use; and dimensions and heights of local changes in elevation. Occasionally, notebooks identified geological features or mineral deposits and animal species found in a township.
Land cover information initially recorded in field notebooks was transferred by surveyors onto standardized township base maps. Upon completion of a survey, the surveyor was required to submit documentation to the Department of the Interior confirming the survey work. Among the material submitted were the field notebook and compiled township plan. In the final pages of the field notebooks a written summary report of the state of the landscape and environment was included.
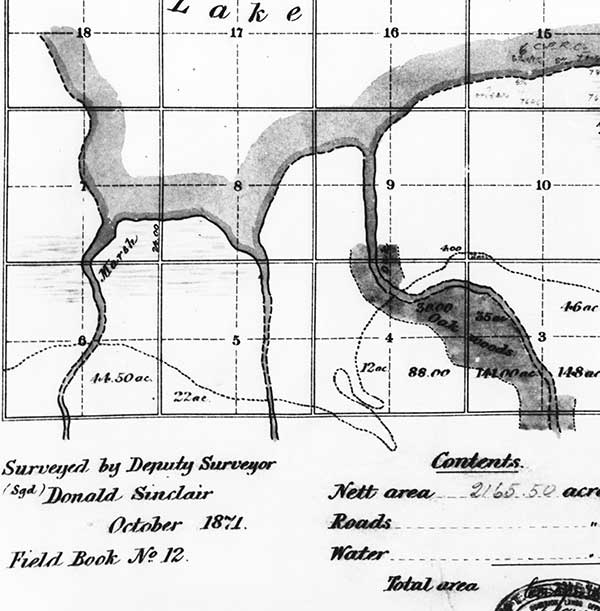
A Dominion Land Survey map of Township 14, Range 7 West of the First Meridian was based on a survey in October 1871. The map itself, a portion of which is shown here, was made in June 1872.
Source: Manitoba Conservation, Maps Branch.
My study area initially consisted of 194 townships in southern Manitoba but 24 townships were eventually eliminated because they were surveyed later than the initial surge of surveys in the 1870s. I also included parish maps along the Red and Assiniboine Rivers, and maps for the parishes of Lorette and St. Anne along the Seine River. These 170 townships covered 16,536 km2, most of most of which had been surveyed between 1871 and 1875 with the majority (97%) of the work completed in 1872. Very few surveys were performed in the winter; they occurred only in a few townships where impassable, boggy terrain prevented passage at other times of the year.
Land cover categories similar to the original categories were used for the mapping. To assemble land cover information from the township maps, two distinct components were involved: data collection and data analysis. Data collection involved transcription of the original township plan land cover information. Land cover polygons were traced from the original documents verbatim to ensure interpretations would commence after all relevant data was collected. To produce a GIS map of the entire study area, each township map was georeferenced—that is, “real world” latitude and longitude coordinates had to be assigned to each original township map’s four corners, by comparing them to modern, spatially accurate maps of the same areas. Then, each township map was placed on a digitizing tablet and landscape features (prairie, wetland, woodland, scrub, and water) were traced. All written remarks relating to land cover were also transcribed from the original township plans. Target information extracted from township plans and specific to land cover included references to prairie land, wooded areas, wetland areas, scrub vegetation, surface water bodies or streams, and locations of spring outlets. Human settlement features were also transcribed from township and parish maps. Because the same surveyor did not conduct every township survey, some variations in land cover interpretation were evident. However, this was not a significant problem. To assess the reliability of original classifications, the written descriptions of land cover were analysed. This analysis showed that surveyors consistently used a small selection of a few key words or phrases when describing landscape features. Once digital representations of all township maps were obtained, they were combined together to make one seamless map of the entire area.
There were two problems in obtaining landscape information from township maps. First, the extent and, in some cases, the location of features was not always fully delineated in the original maps. Dense woods and impassable wetlands could prevent surveyors from mapping them completely. Consequently, some features in the digital map may be larger or smaller than they should be. A second problem was that a landscape feature beginning in one township map did not always continue on the adjoining map. This may have been caused by maps having been prepared by different surveyors who varied in their degree of thoroughness. Or, that the surveys took place at different seasons of a year and in different years. So, for example, a wetland might be present in one map prepared in a wet year, but absent from its neighbouring map done in a dry year. A number of these cases were resolved by referring to the original field notebooks.
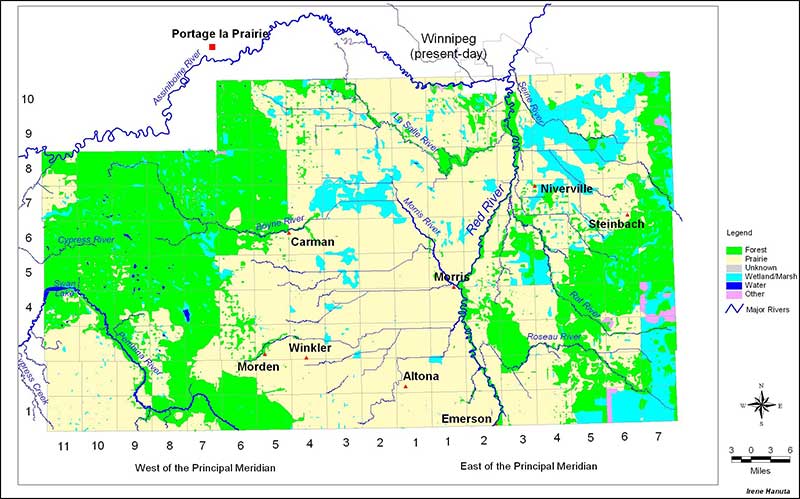
My map of southern Manitoba in the 1870s—see the following page—illustrates a landscape in which about 55% of the area was unbroken prairie, with the remainder made up of forest (35%), wetlands (10%), and a variety of smaller features (water, agricultural land, settlements, burned and unclassified areas) collectively representing under 1%. Data for 1995 obtained from the Prairie Farm Rehabilitation Administration show that 85% of the same area is in some form of agriculture (cropland, forage, or grassland); forests represent 9%, wetlands are about 1%, and urban area and transportation corridors make up the remaining 5%. Clearly, the landscape of southern Manitoba has changed remarkably in about 120 years, showing the extent of human impacts on our environment.
The landscape of southern Manitoba in the 1870s was reconstructed using 170 townships maps of the Dominion Land Survey. Individual townships are denoted by the horizontal and vertical grid lines. The locations of some modern features, such as towns and cities, were added for reference. Township numbers are denoted on the left side; range numbers are shown along the bottom.
Source: I. Hanuta
Page revised: 11 June 2014